
Selected highlights of Machine Learning and Analytics Projects
Seasonally Adjusted Projections
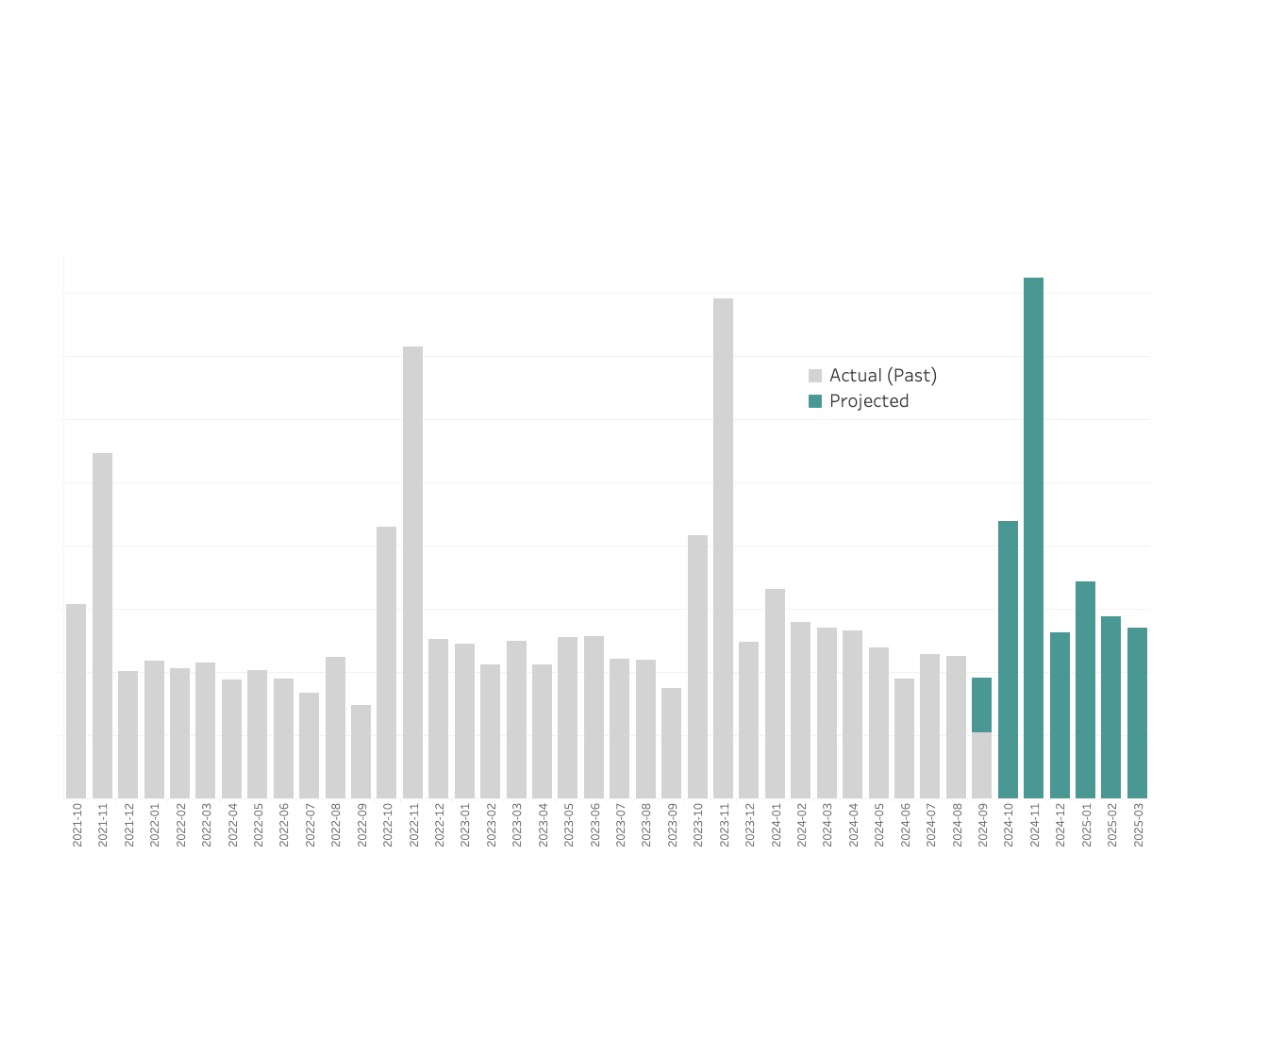
I recently faced a challenge to help a Customer Support department predict customer call volume: how many phone calls might arrive next month? The problem: customers have widely varying volumes, different seasonal patterns, and not always enough history.
This time-series analysis required seasonal decomposition in a way that addressed these challenges. By developing a portable metric called "Monthly Seasonal Percentage", I was able to move beyond individual customers to detect industry seasonality and with that, expand the projections to customers without year over year history. Read more about the project here.
Manually Compute Mutual Information
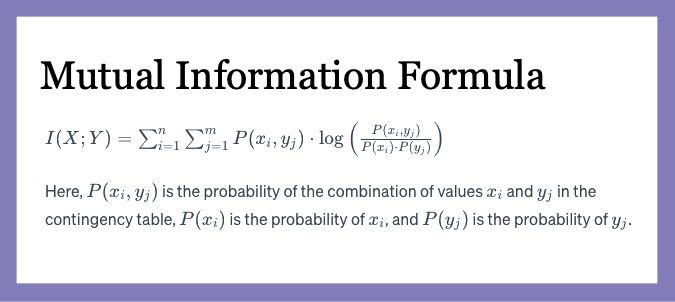
This notebook computes Mutual Information manually and compares outputs to sklearn's package. This confirms the math behind it and ensures understanding of the inner-workings of the function. This was an exercise under mentorship at work before using Mutual Info to evaluate features in a retention model.
Cases considered were: Continuous, Discrete (binary), and Discrete (not binary); Titanic test data was used.
Random Variable Generator
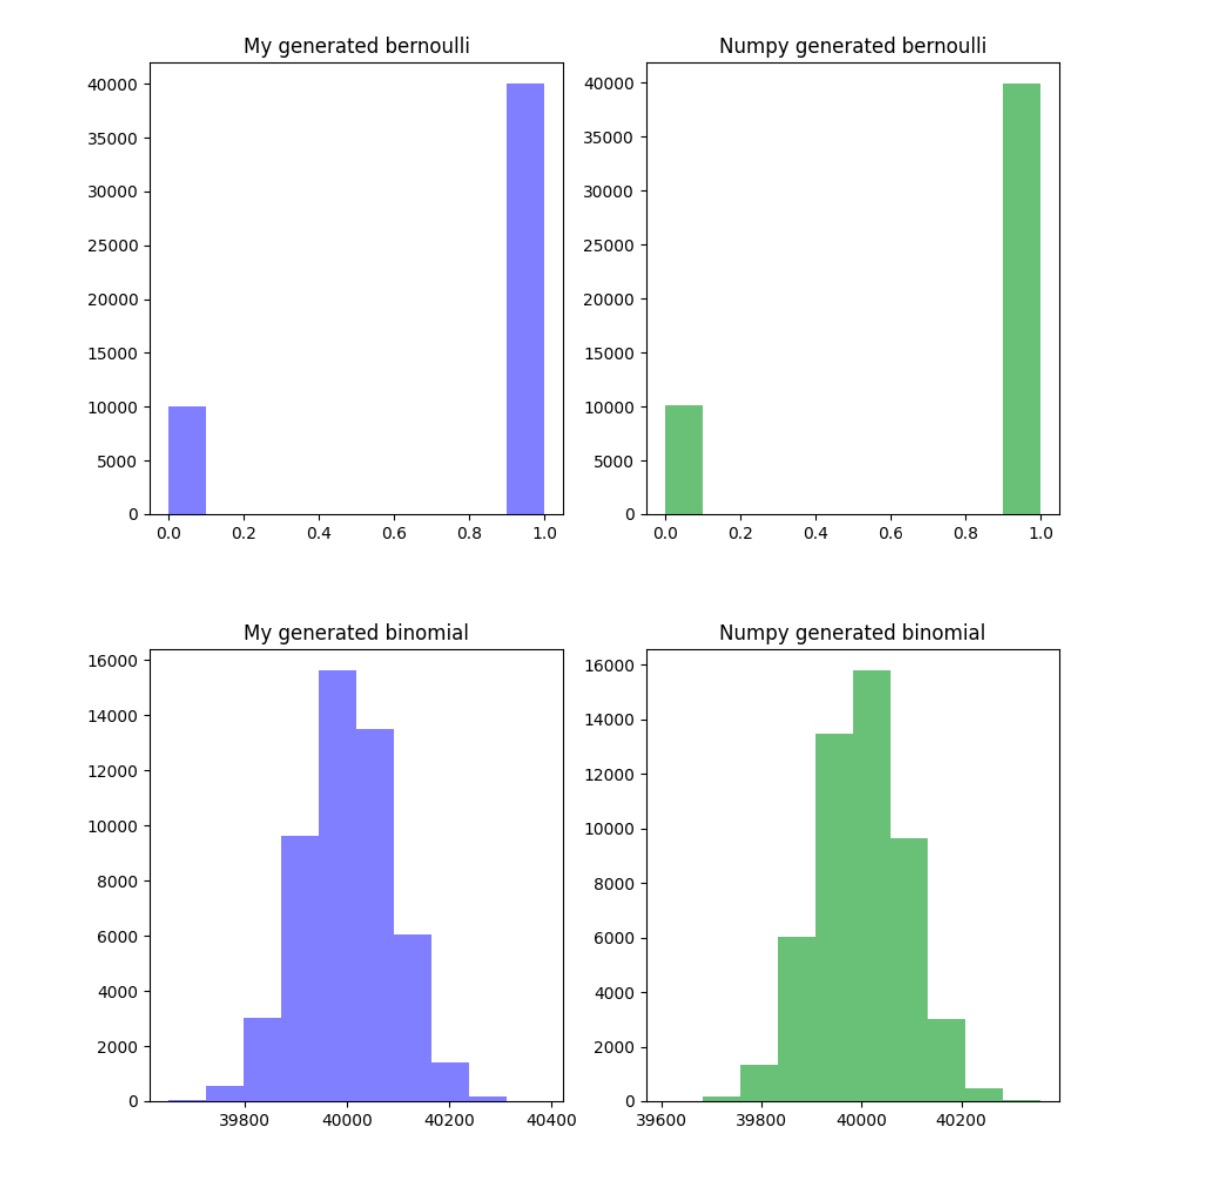
In this coding project I created a Random Variate Generator, which creates both discrete and continuous random variates from common distributions such as Geom(p), Exp(λ), Normal(μ,σ2), Gamma(α,β), Weibull(α,β), etc. Here I start with a uniform distribution and build the others, plotting my code's output against numpy's built-in generators.
The need for such a "classroom" project came into clear focus at work when I built a Bayesian Inference model to predict customer retention. Choosing the prior distributions were especially important given the small dataset I had (so it didn't overly influence outcomes), and this in-depth study paid off.
Sports Analytics
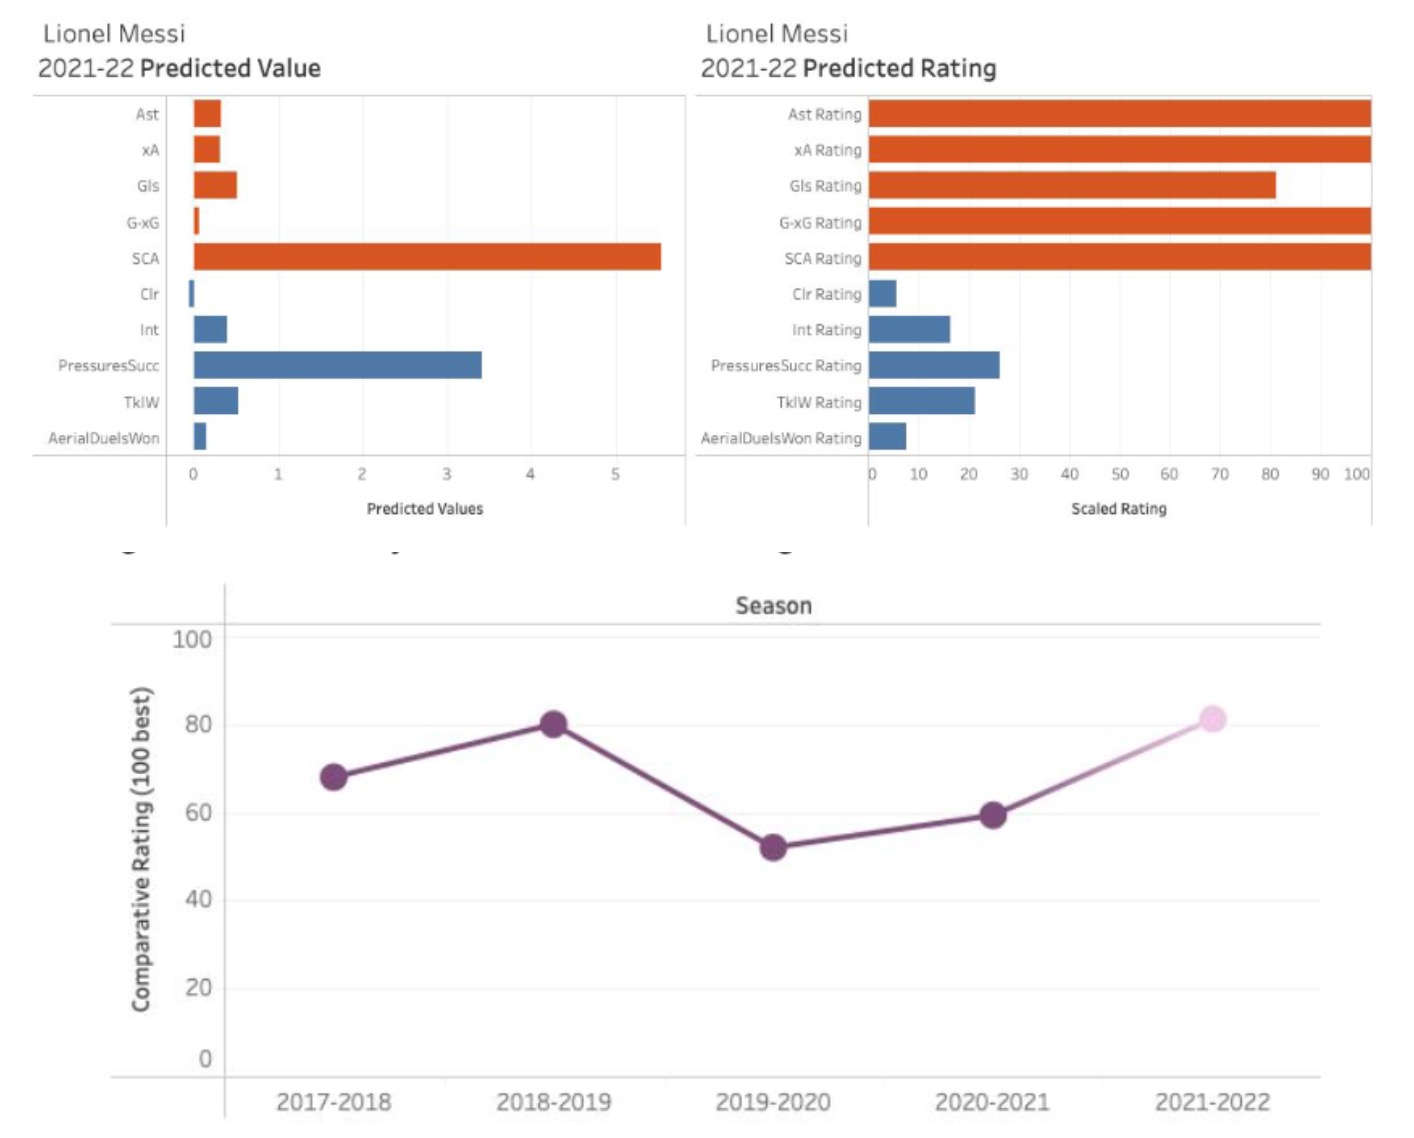
Predict player performance in Europe’s Big 5 Soccer Leagues, incorporating team play style and league effects. K-means clustering was used to group team play style, and Group Lasso Regression for predictions. (group project).
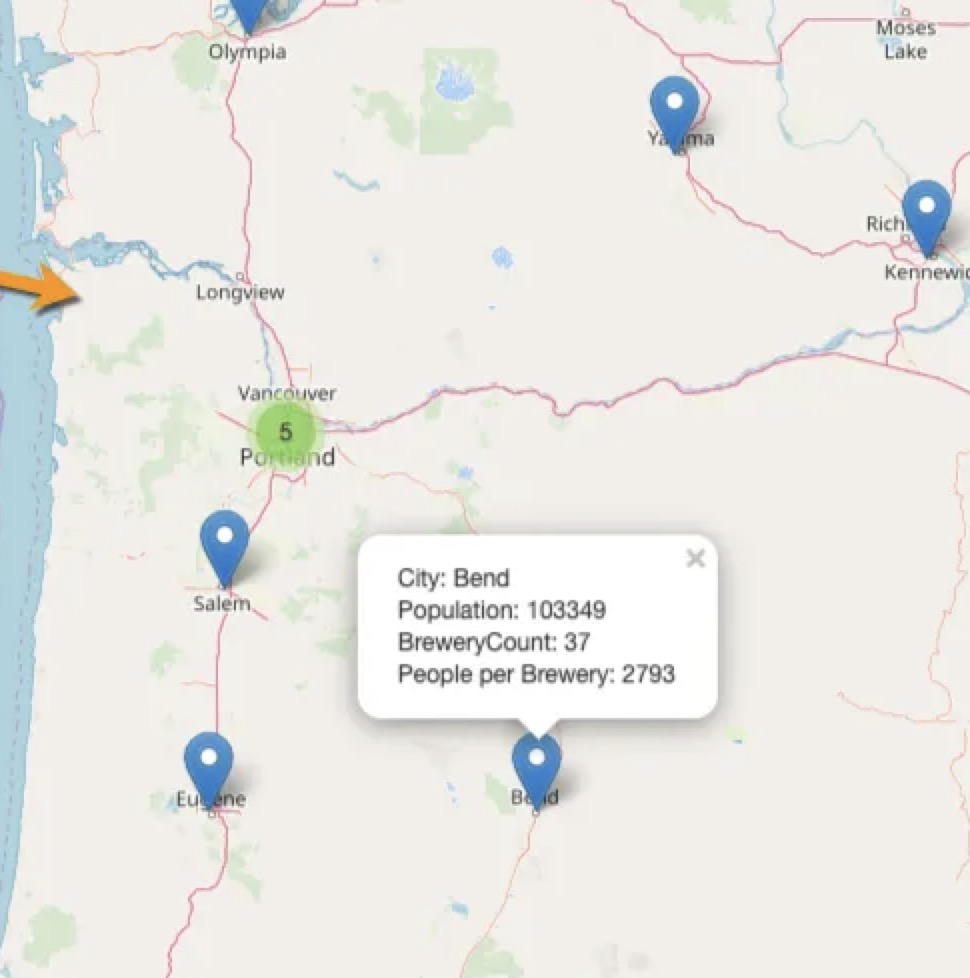
Mapping Breweries per Capita
Mapped Breweries per Capita using pandas, python, matplotlib, foursquare API and folium maps. A fun project = beer lover's West Coast travel guide.
Humanized Data
A loose collection of somewhat outdated blog posts representing early work on python/pandas, and data engineering.